BET (Brunauer–Emmett–Teller) analysis is a powerful tool for characterizing the surface and porosity of solid materials. It provides key information such as:
Specific Surface Area — Measures the total surface area per unit mass (m²/g)
Total Pore Volume — Estimates the overall volume of pores in the material
Average Pore Diameter — Calculates the mean pore size based on surface area and pore volume
Adsorption/Desorption Isotherms — Used to assess pore type and adsorption behavior
Initial Porosity Screening — Helps determine if the material is micro-, meso-, or macroporous
BET is often the first step in porous material analysis, offering quick and reliable insights before more advanced pore size distribution methods (like BJH or DFT) are applied. It plays a critical role in understanding the surface properties of powders, porous structures, and functional materials in both research and industrial applications.
2. Scope
BET surface area analysis is a highly versatile technique used across a wide range of material types and industries. It is particularly effective for characterizing powders, porous materials, and nanomaterials with medium to high surface area. The method is applicable to both organic and inorganic solids, including:
Applicable Material Types:
Inorganic powders: alumina, silica, calcium carbonate, talc, etc.
Adsorbents and separation media: molecular sieves, functional resins, silica gels
Polymers and membranes: porous polymer membranes, foams, aerogels
Industries and Applications:
Chemicals and Catalysis: surface area as a key parameter for catalytic activity and screening
Energy storage: surface optimization of electrode materials for batteries and supercapacitors
Environmental engineering: assessment of gas and liquid adsorbents, VOC capture, wastewater treatment
Construction and Coatings: porosity evaluation in cementitious materials and functional fillers
Pharmaceuticals: drug carriers and excipients, controlled-release systems
1. Why is the BET surface area value negative?
A: Under normal circumstances, if the sample adsorbs gas molecules, the BET surface area should be positive. A negative value may be caused by several reasons:
Sample characteristics: If the adsorption-desorption isotherm shows no significant adsorption, values may hover near zero. Minor instrument deviations can result in negative readings, especially when adsorption is negligible.
Insufficient sample amount: If too little sample is used, the total adsorption is very low, which can lead to inaccurate or negative values.
Improper degassing conditions: Overheating during degassing may damage the pore structure, while too low a temperature or insufficient degassing time can lead to incomplete outgassing, affecting the results.
2. Why is the adsorption-desorption isotherm not closed?
A: This is a common phenomenon and may occur for several reasons:
The material has special surface groups or chemical properties that strongly retain gas molecules, preventing full desorption.
The sample has a very small specific surface area, which typically results in poor isotherm closure.
Insufficient sample quantity can lead to unstable readings and poor curve definition.
Improper pretreatment—such as overheating—can collapse pore structures, making it difficult for gases to desorb.
For carbon-based materials, which often contain flexible or ink-bottle-shaped pores, the pore entrances may shrink after adsorption, trapping gas molecules and leading to non-closure of the isotherm.
3. Why does the BJH desorption pore size distribution show a “false peak”?
A: During gas desorption, hysteresis often occurs. This can create an artificial peak in the BJH pore size distribution, commonly around 3.8 nm. The false peak is usually related to: pore connectivity, complex pore geometries, and wide pore size distributions—all of which affect the desorption pathway.
4. Why is the C value in the BET equation negative?
A: The C value reflects the sample's adsorption heat and should normally be positive. If it is negative:
Check the magnitude. If it is significantly negative, try excluding high-pressure data points or narrowing the pressure range to re-fit the curve.
For mildly negative values, this often occurs with microporous materials where the BET model assumptions do not hold. In such cases, the Langmuir model may provide a more accurate surface area measurement.
5. Why do the adsorption and desorption curves cross each other?
A: This crossover may result from:
Very low adsorption values, making the signal prone to fluctuation.
Inadequate degassing—either too low in temperature or too short in duration—leaving residual moisture that desorbs during measurement.
BET surface area analysis is a highly versatile technique used across a wide range of material types and industries. It is particularly effective for characterizing powders, porous materials, and nanomaterials with medium to high surface area. The method is applicable to both organic and inorganic solids, including:
Applicable Material Types:
Inorganic powders: alumina, silica, calcium carbonate, talc, etc.
Adsorbents and separation media: molecular sieves, functional resins, silica gels
Polymers and membranes: porous polymer membranes, foams, aerogels
Industries and Applications:
Chemicals and Catalysis: surface area as a key parameter for catalytic activity and screening
Energy storage: surface optimization of electrode materials for batteries and supercapacitors
Environmental engineering: assessment of gas and liquid adsorbents, VOC capture, wastewater treatment
Construction and Coatings: porosity evaluation in cementitious materials and functional fillers
Pharmaceuticals: drug carriers and excipients, controlled-release systems
Aerospace and Advanced Materials: lightweight porous structures, insulating materials
Caption: Example of BET results.
Parameter
Value (m²/g)
Single point surface area at P/Po = 0.220294209
30.4405
BET Surface Area
31.3770
Langmuir Surface Area
205.6132
t-Plot external surface area
31.6115
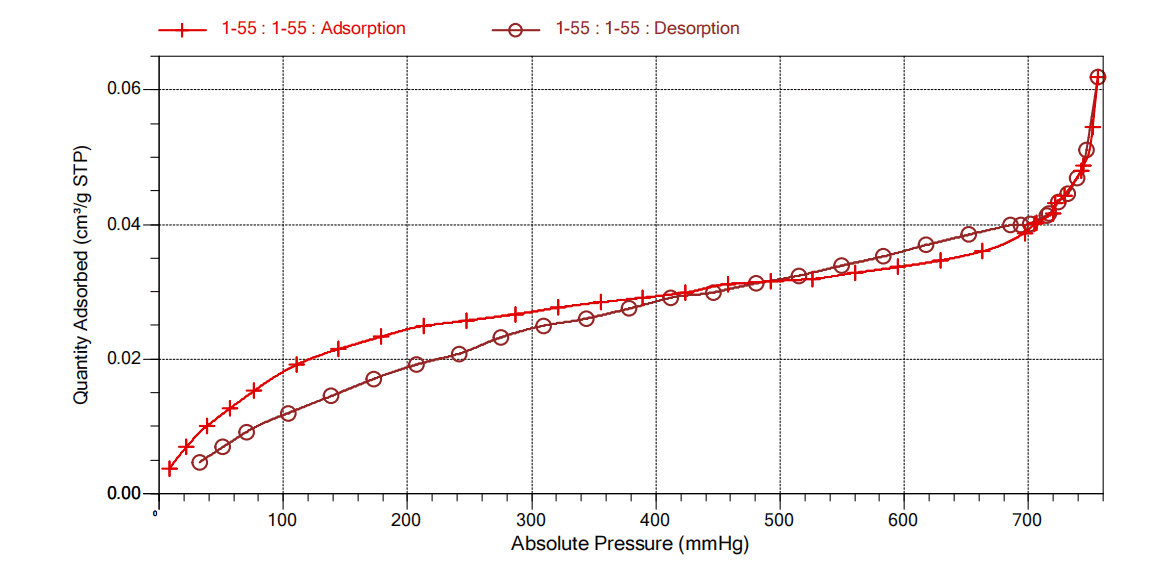
Caption: BET-Isotherm Linear Absolute Plot
To ensure reliable results, please follow these/mple guidelines:
Quantity: Typically 0.1–1.0 g of dry, powdered sample
Condition: The sample should be clean, dry, and free of volatiles
Packaging: Store in airtight containers; avoid exposure to humidity or air if the material is reactive
Special Handling: If the sample is sensitive to air or moisture, please provide handling instructions in advance
Feel free to contact our team for questions regarding specific materials or sample preparation requirements. If your sample exceeds standard requirements, please contact us for a customized solution.
Aerospace and Advanced Materials: lightweight porous structures, insulating materials
By combining BET with complementary techniques such as BJH, Langmuir, or microscopic imaging (SEM/TEM), users can obtain a more comprehensive understanding of pore structure and surface behavior. For example, MOF materials benefit from BET + Langmuir to resolve micropore contributions, while carbon-based adsorbents are often analyzed using BET + BJH to assess mesopores. Combining BET data with SEM images supports deeper material insight and application design.
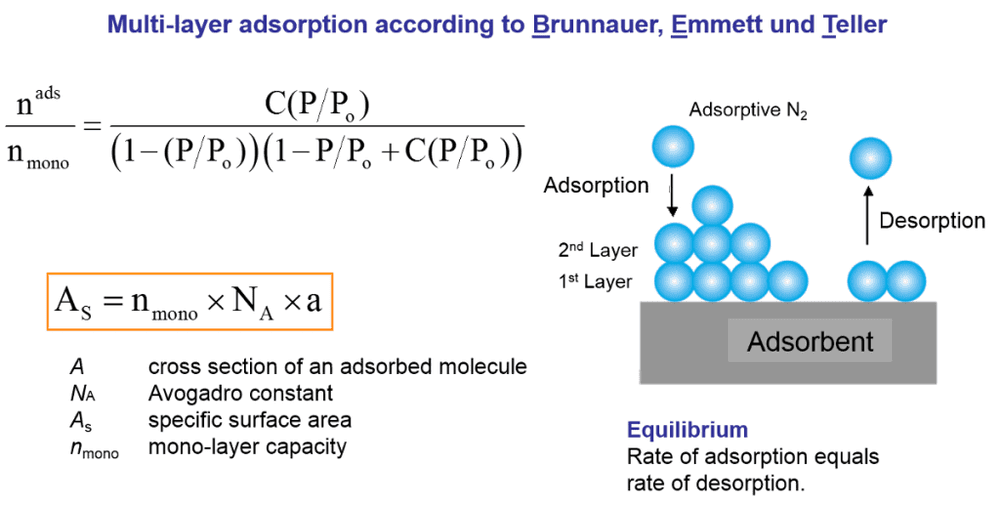
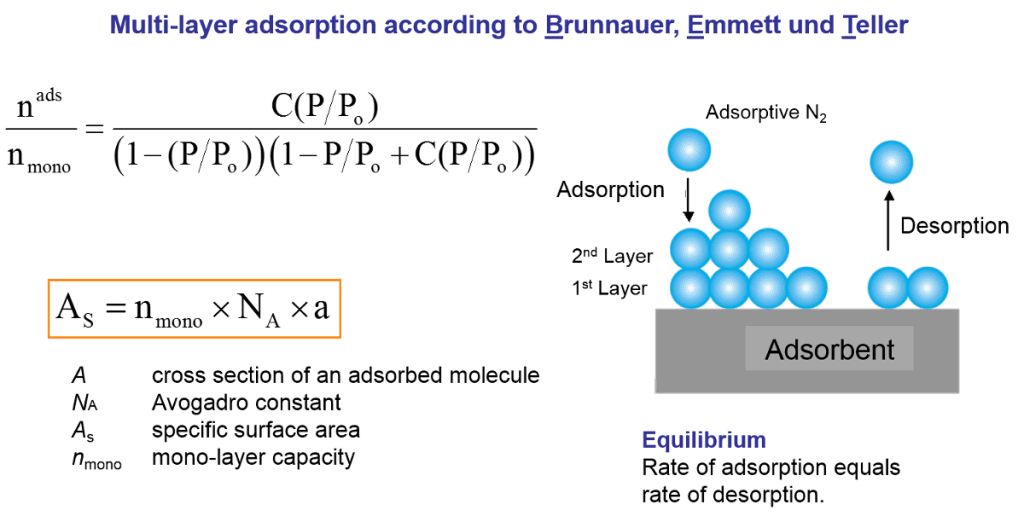
3. Principle
The BET (Brunauer–Emmett–Teller) theory describes the physical adsorption of gas molecules on a solid surface through multilayer formation. It extends the Langmuir model by assuming that after the first monolayer is adsorbed, additional layers can form on top. The BET equation relates the amount of gas adsorbed at various relative pressures to calculate the monolayer capacity, based on assumptions of uniform surface energy and no lateral interactions between adsorbed molecules.
1 Caption: Mathematical principles for calculation of BET surface area
4. Test Procedure
The BET analysis process includes the following key steps:
Sample Degassing: The sample is heated under vacuum or inert gas to remove moisture and volatile impurities.
Adsorption Measurement: The sample is cooled in liquid nitrogen, and nitrogen or other suitable gases are introduced at different relative pressures.
Data Collection: The adsorption isotherm is recorded.
BET Calculation: The surface area is calculated using the BET equation based on the adsorption data.
This process is performed using fully automated, high-precision gas adsorption instruments to ensure accuracy and repeatability.
5. Sample Requirements
To ensure accurate results, please follow these sample preparation guidelines:
Sample amount: Typically 0.1–1.0 g, depending on material type
State: Dry, finely divided powder or granules
Packaging: Airtight and moisture-proof containers
Special materials: For air- or moisture-sensitive samples, please inform us in advance and provide specific handling instructions
Contact our team for assistance with any special material conditions.
6. Pros and Cons
Comparison of Porosity Analysis Methods (Method as Columns)
Attribute
BET Analysis
BJH Method
Langmuir Model
Mercury Porosimetry
Permeability Methods
Working Principle
Multilayer gas adsorption using nitrogen
Desorption-based pore size calculation via Kelvin equation
Monolayer adsorption theory on microporous surfaces
Mercury forced into pores under high pressure
Measures gas/liquid flow through sample
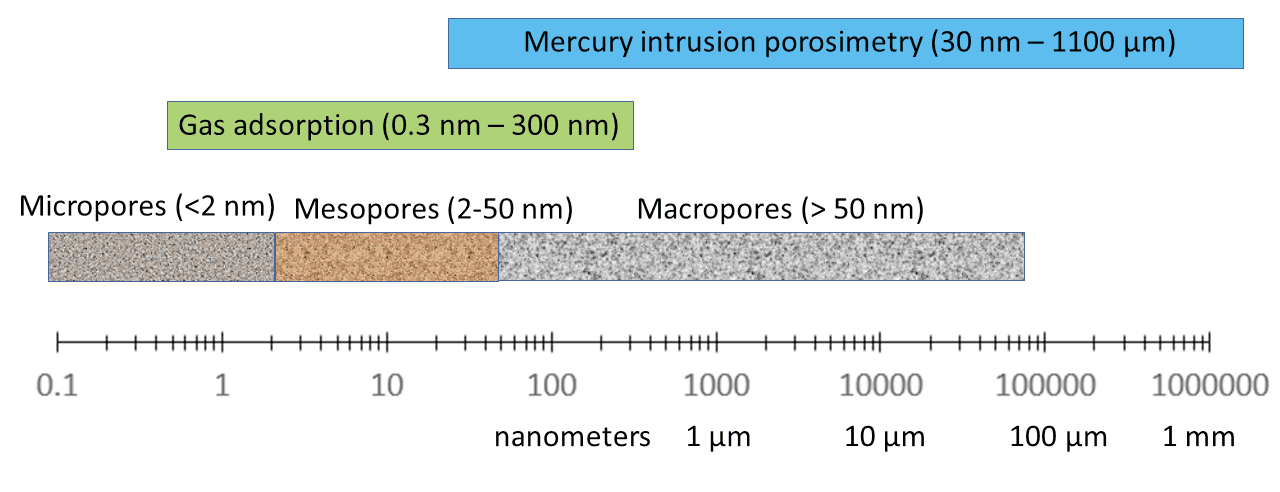
Pore Size Range
0.5 – 100 nm (effective: 1–50 nm)
2 – 50 nm
< 2 nm
3 nm – 500 µm (most accurate > 50 nm)
> 100 nm (bulk level only)
Strengths
High accuracy in surface area; standardized method
Provides mesopore size and volume distribution
Accurate for micropores with strong adsorption
Measures large pores and total pore volume
Fast, non-adsorptive, good for overall porosity
Limitations
Cannot determine pore size distribution; poor for micropores
Inaccurate for micropores; prone to artifacts
Ideal surface assumption; sensitive to pressure points
Low resolution; affected by tortuosity and structure
Recommended Materials
Catalysts, nanopowders, porous oxides
Mesoporous silica, activated carbon
Zeolites, MOFs, activated carbon
Concrete, ceramics, foams, filters
Membranes, filters, construction materials
2 Caption: Overview of Suitable Analytical Methods for Various Pore Size Ranges
Advantages:
High sensitivity and reproducibility
Non-destructive testing
Standardized methodology (e.g., ISO 9277)
Applicable to a wide range of materials
Limitations:
Requires sample pretreatment (degassing)
Less effective for materials with very low surface area
7. Example results
Caption: Example of BET results.
Parameter
Value (m²/g)
Single point surface area at P/Po = 0.220294209
30.4405
BET Surface Area
31.3770
Langmuir Surface Area
205.6132
t-Plot external surface area
31.6115
3 Caption: BET-Isotherm Linear Absolute Plot
8. FAQ
1. Why is the BET surface area value negative?
A: Under normal circumstances, if the sample adsorbs gas molecules, the BET surface area should be positive. A negative value may be caused by several reasons:
Sample characteristics: If the adsorption-desorption isotherm shows no significant adsorption, values may hover near zero. Minor instrument deviations can result in negative readings, especially when adsorption is negligible.
Insufficient sample amount: If too little sample is used, the total adsorption is very low, which can lead to inaccurate or negative values.
Improper degassing conditions: Overheating during degassing may damage the pore structure, while too low a temperature or insufficient degassing time can lead to incomplete outgassing, affecting the results.
2. Why is the adsorption-desorption isotherm not closed?
A: This is a common phenomenon and may occur for several reasons:
The material has special surface groups or chemical properties that strongly retain gas molecules, preventing full desorption.
The sample has a very small specific surface area, which typically results in poor isotherm closure.
Insufficient sample quantity can lead to unstable readings and poor curve definition.
Improper pretreatment—such as overheating—can collapse pore structures, making it difficult for gases to desorb.
For carbon-based materials, which often contain flexible or ink-bottle-shaped pores, the pore entrances may shrink after adsorption, trapping gas molecules and leading to non-closure of the isotherm.
3. Why does the BJH desorption pore size distribution show a “false peak”?
A: During gas desorption, hysteresis often occurs. This can create an artificial peak in the BJH pore size distribution, commonly around 3.8 nm. The false peak is usually related to: pore connectivity, complex pore geometries, and wide pore size distributions—all of which affect the desorption pathway.
4. Why is the C value in the BET equation negative?
A: The C value reflects the sample's adsorption heat and should normally be positive. If it is negative:
Check the magnitude. If it is significantly negative, try excluding high-pressure data points or narrowing the pressure range to re-fit the curve.
For mildly negative values, this often occurs with microporous materials where the BET model assumptions do not hold. In such cases, the Langmuir model may provide a more accurate surface area measurement.
5. Why do the adsorption and desorption curves cross each other?
A: This crossover may result from:
Very low adsorption values, making the signal prone to fluctuation.
Inadequate degassing—either too low in temperature or too short in duration—leaving residual moisture that desorbs during measurement.
Leaks in the experimental setup, such as loose sample tubes or aged O-rings, leading to inconsistent gas flow and overlapping curves.
6. Why doesn’t the pore size distribution start from zero?
A:
The graph starts displaying values only where pores are detected; if there are no pores at lower pressures, no data is shown in that region.
The minimum pore size detectable depends on the diameter of the adsorbate molecule used (e.g., nitrogen), so the distribution theoretically starts from that molecular diameter.
7. Why do BET results differ from SEM or TEM observations?
A: SEM/TEM images show local features of a small region, while BET measures the overall pore structure of the bulk material. Discrepancies may arise because:
Electron microscopy may detect pores in localized regions that are not representative of the whole sample.
SEM magnification can introduce scale errors.
Therefore, BET and electron microscopy are complementary, but not always directly comparable.
9. Conclusion
BET surface area analysis is an essential technique for understanding and optimizing the surface and pore properties of materials. It supports decision-making in material design, quality assurance, and product development across multiple industries.
Contact us today to discuss your analysis needs or to submit your samples for testing.
Leaks in the experimental setup, such as loose sample tubes or aged O-rings, leading to inconsistent gas flow and overlapping curves.
6. Why doesn’t the pore size distribution start from zero?
A:
The graph starts displaying values only where pores are detected; if there are no pores at lower pressures, no data is shown in that region.
The minimum pore size detectable depends on the diameter of the adsorbate molecule used (e.g., nitrogen), so the distribution theoretically starts from that molecular diameter.
7. Why do BET results differ from SEM or TEM observations?
A: SEM/TEM images show local features of a small region, while BET measures the overall pore structure of the bulk material. Discrepancies may arise because:
Electron microscopy may detect pores in localized regions that are not representative of the whole sample.
SEM magnification can introduce scale errors.
Therefore, BET and electron microscopy are complementary, but not always directly comparable.
BET (Brunauer–Emmett–Teller) Surface Area Analysis is a widely used method for evaluating the surface properties of materials. It is primarily applied to the analysis of specific surface area and pore structure in porous materials.
By utilizing the adsorption characteristics of solid materials and employing gas molecules as “measuring probes,” the BET method enables precise characterization of surface and porosity-related features. The test provides key parameters such as:
Specific surface area, Total pore volume, Pore size distribution, Adsorption/desorption isotherms.