Raman spectroscopy is an analytical technique based on the Raman scattering effect, in which the scattered light with frequencies different from the incident light is analyzed to obtain information about molecular vibrations and rotations, and is thus applied to the study of molecular structures.
As a type of scattering spectroscopy, Raman spectroscopy arises from the interaction between light and chemical bonds within materials, providing information on the chemical structure, phases and morphology, crystallinity, and molecular interactions of a sample.
Raman spectroscopy enables accurate, rapid, and non-destructive identification of material types, and is widely used in fields such as materials science, chemistry, physics, environmental science, and medicine. It has become an indispensable tool in both scientific research and industrial production.
Advantages
Non-destructive testing and trace analysis
Simple operation and rapid analysis
High specificity, high sensitivity, and high stability
Broad applicability
Scope
Molecular Structure Identification
Chemical Composition Analysis
Principle
Principle
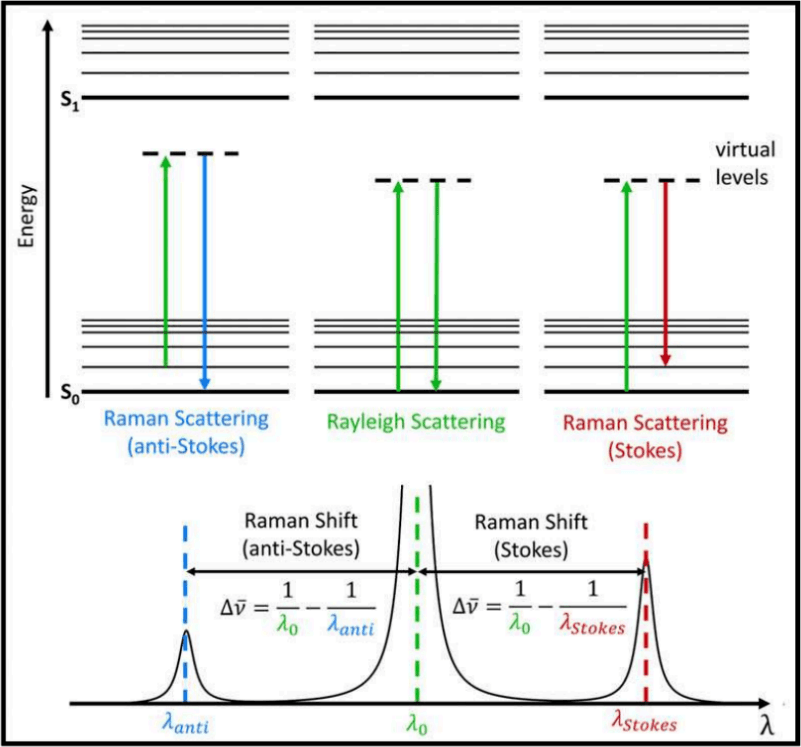
Raman is a type of light scattering technique. When the high-intensity incident light from a laser source is scattered by molecules, most of the scattered light has the same wavelength (color) as the incident laser, a phenomenon known as Rayleigh scattering. However, a very small portion (about 1 in 10^9) of the scattered light has a different wavelength (color) from the incident light, and the change in wavelength is determined by the chemical structure of the test sample (the so-called scattering substance). This portion of scattered light is referred to as Raman scattering.
Possible reasons include:
(1) Raman spectroscopy is a selective measurement technique with a typical testing range of about 1 micrometer and a penetration depth at the nanoscale to microscale level. If the sample is unevenly distributed, the test results can vary significantly. For instance, when measuring multiple points, some may show peaks while others do not, necessitating a judgment based on the sample's characteristics.
(2) The material may not contain the substance in question, resulting in no peaks, or it may be present in very low concentrations.
(3) Fluorescence interference may be an issue, so careful consideration of the laser selection is required.
Wavelength Range
Excitation Wavelength
Advantages
Disadvantages
Common Application Areas
UV
325 nm
High energy (high excitation efficiency), strong Raman scattering effect, improved spatial resolution, and suppression of fluorescence.
Can easily damage samples, high cost of lasers, and stringent filtering requirements (high-quality optical lenses).
Samples with weak fluorescence
Visible
488 nm, 514 nm, 532 nm, 633 nm
Wide application range
Strong fluorescence signals
Materials, chemistry, chemical reactions (inorganic materials), biomedical applications, resonance (graphene, carbon materials), etc.
Infrared
785 nm, 830 nm, 1064 nm
Minimal fluorescence interference
Low excitation energy (low excitation efficiency), weak Raman signals
Suppression of fluorescence, chemical industry, biological tissues, organic materials
Dp=λ/4πK (where ( D_p ) is the penetration depth of the laser wavelength in the sample, and ( K ) is the extinction coefficient).
From the above formula, it can be seen that different excitation wavelengths correspond to different penetration depths.
application
(1) Materials Science:
Characterization of Two-Dimensional Materials
Nanocomposites
Catalytic Materials
(2) Biomedicine and Pharmaceutical Analysis
(3) Environmental Monitoring:
Enabling rapid detection of chemical components in environmental samples such as water and air. Its non-destructive nature makes it highly valuable in environmental science.
(4) Industrial Applications:
In the industrial sector, Raman spectroscopy is used for food safety testing, pharmaceutical analysis, and gemstone identification. It allows for the rapid identification of sample components, ensuring product quality and safety.
(5) Life Sciences:
Raman spectroscopy can be used for structural analysis of biological macromolecules such as proteins and nucleic acids, as well as for detecting concentration changes of specific molecules within cells. In addition, Raman spectroscopy can be applied to the detection of cancerous changes in cells and tissues, making it one of the methods for tumor diagnosis.
(6) Forensic Science:
Raman spectroscopy can be used to analyze physical evidence from crime scenes. It also enables non-destructive detection of traces such as explosives and ink, providing a powerful scientific tool for presenting evidence in court.
Raman spectroscopy
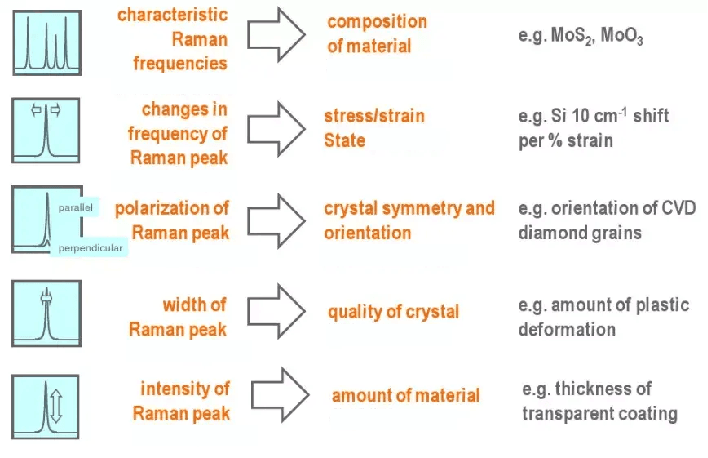
Generally, Raman spectroscopy can provide the following information:
Composition of the substance: The specific composition is usually determined by analyzing the vibrations of molecular bonds, which are identified by Raman frequencies.
Stress/strain in the studied material: Changes in the positions of Raman peaks can be used to assess certain mechanical properties of the material.
Quantity of the substance: The intensity of the Raman peaks reflects the total amount of the substance present.
Crystal quality: This information is indicated by the width of the Raman peaks.
Crystal symmetry and orientation: The polarization characteristics of the Raman spectrum reveal the symmetry and orientation of the crystal.
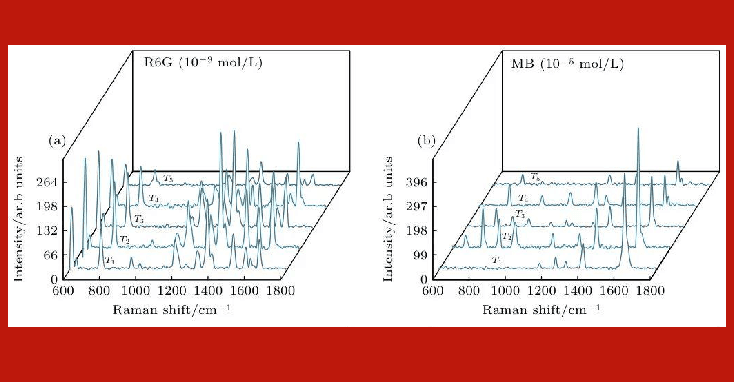
SERS Detection of Dye Molecules (R6G and MB)
SERS Detection of Dye Molecules (R6G and MB)
DOI: 10.7498/aps.72.20221958
Experimental Background:Trace detection of dyes is of great significance in environmental monitoring.
Spectral Analysis:
For R6G (10⁻⁹ mol/L), the intensities of the 612 cm⁻¹ (C–C ring breathing vibration) and 773 cm⁻¹ (C–H bending vibration) peaks decrease over time.
For MB (10⁻⁵ mol/L), the intensities of the 1393 cm⁻¹ (C–N stretching vibration) and 1624 cm⁻¹ (aromatic ring vibration) peaks decrease by 50% within 30 minutes.
Conclusion:SERS substrates can stably detect dye molecules, but the detection time should be controlled to avoid photodegradation.
The required amount of powder is more than 10 mg.
The size of solid/block samples should be a minimum of 2 x 2 mm and a maximum of 5 x 5 cm.
For liquids, they must be non-toxic, non-volatile, and non-corrosive, with a required volume of more than 2 mL. Higher concentrations are preferred, and the presence of suspended particles is ideal.
A typical Raman spectrum consists of a certain number of Raman peaks, each representing the wavelength position and intensity of the corresponding Raman scattered light. Each spectral peak corresponds to a specific molecular bond vibration, which may involve a single chemical bond—such as C–C, C=C, N–O, or C–H—or the vibrations of functional groups composed of several bonds, such as the breathing mode of a benzene ring, the vibrations of long polymer chains, and lattice vibrations.
In general, a Raman spectrum serves as a unique chemical fingerprint for a specific molecule or material, enabling rapid identification of material types or differentiation between different materials. Raman spectral databases contain thousands of spectra; by quickly searching for spectral data that matches the analyte, the substance can be accurately identified.
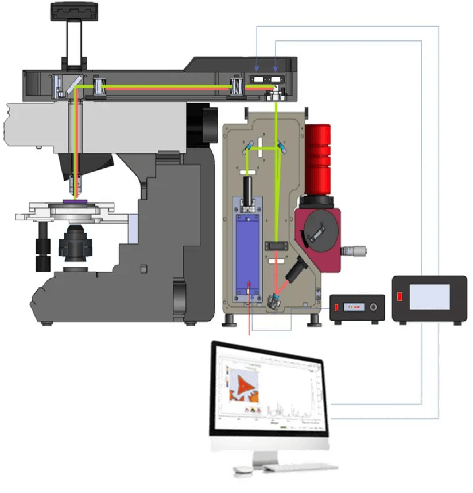
Test procedure
Place the sample on a glass slide and move it under the testing lens for optical focusing.
Perform a secondary laser focus to achieve good photon collection.
Select the laser and switch between lasers, adjusting the laser power for preliminary testing. Based on the results of the preliminary test, set the integration time and configure the grating size.
Click to start the test and export the test results.
Longer wavelengths result in deeper penetration, generally ranging from the nanoscale to the microscale.
Raman spectroscopy is a non-destructive analytical technique based on the interaction between light and chemical bonds within materials. By measuring the vibrational modes of a sample through scattered light, this technique provides detailed information about the chemical structure, phases and morphology, crystallinity, and molecular interactions of the sample. It has been widely applied in various fields, including chemistry, materials science, biomedicine, and environmental science.