
info@universallab.org
WhatsApp: +41762172997
Ultraviolet/Visible/Near Infrared Spectroscopy UV/VIS/NIR
Variant (SKU)
Bandgap width (Eg)
Colour characteristics
Material optical properties
Price may vary based on selected options
Delivery time: 1 ~ 2 weeks
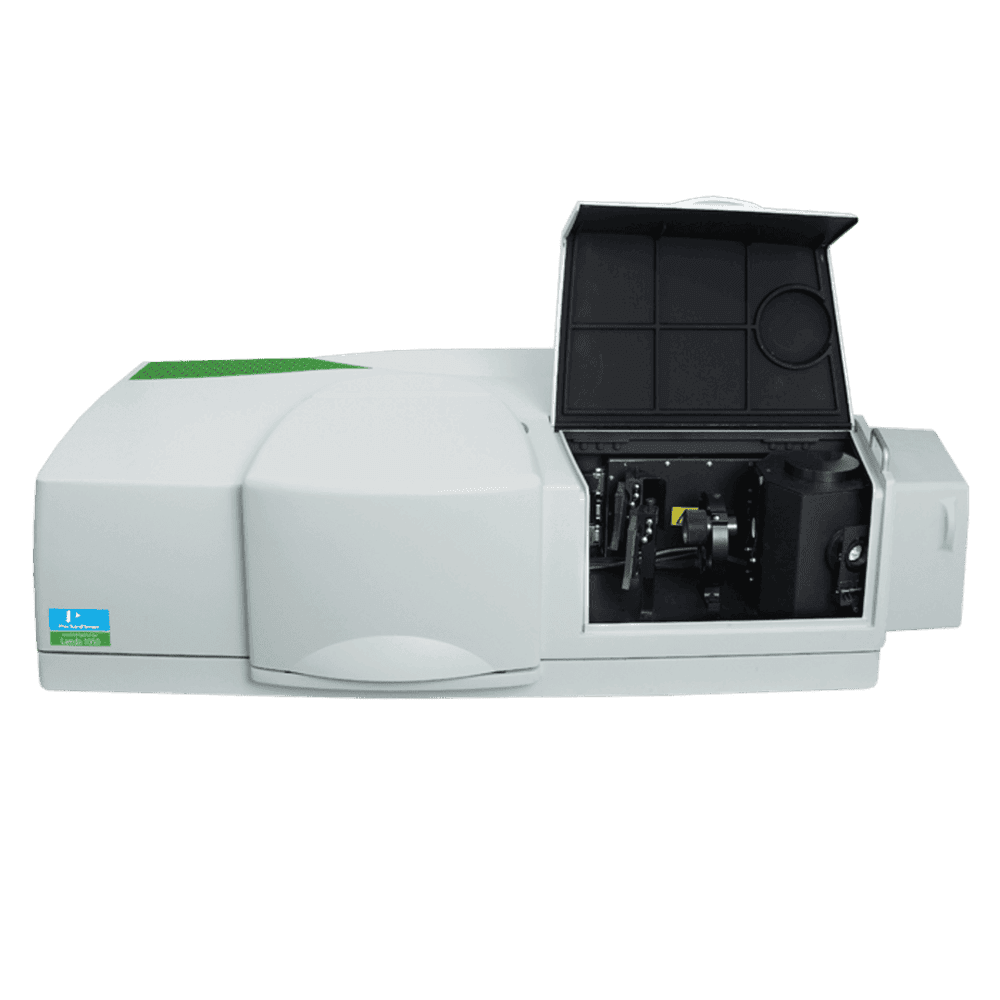
UV-Vis-NIR spectrometers are mainly used for qualitative and quantitative analysis in various fields such as organic compound structure confirmation, pharmaceutical analysis, polymer materials, and nanophotonic materials. They can be used for absorption, transmission, and scattering measurements. Equipped with a 150 mm integrating sphere and URA accessories, these instruments can test the spectral information of various samples including powders, solids, films, and optical glass. They are suitable for measuring the optical properties of materials, such as absorption, transmission, specular scattering, and diffuse reflectance.

Introduction
Introduction
Ultraviolet-visible-near-infrared spectroscopy refers to the technique in which molecules or groups within a substance absorb incident ultraviolet or visible light energy, producing characteristic band spectra. It is a method for studying the relative intensity of light absorption by molecular species. This technique can be used to characterize the transitions of valence electrons in compounds, thereby helping to determine the structure and properties of the compounds. It can be used for both qualitative analysis (mainly to identify functional groups in molecules) and quantitative analysis, and is applicable to both inorganic and organic compounds.
Advantages
- Simple operation and fast testing; sample preparation is relatively easy.
- High sensitivity, capable of detecting low concentrations of substances.
- Suitable for both qualitative and quantitative analysis; widely applicable to organic, inorganic, and biological samples.
- Non-destructive for many samples.
- Widely available instruments with low maintenance costs.
Principle
When a molecule absorbs ultraviolet light of a certain wavelength, the valence electrons in the molecule transition from a lower energy level to a higher energy level, resulting in an absorption spectrum known as the ultraviolet absorption spectrum.
- Principle of UV absorption spectroscopy analysis: Absorption of ultraviolet light energy causes transitions between electronic energy levels in the molecule.
- Representation of the spectrum: The spectrum is displayed as the change in relative absorption intensity with respect to the wavelength of the absorbed light.
- Information provided: The position, intensity, and shape of the absorption peaks provide information about different electronic structures within the molecule. UV absorption spectroscopy is mainly used to determine conjugated molecules, components, and equilibrium constants.


Principle
Test procedure
- Liquid samples: Preheat the instrument for 20 minutes. Set parameters (wavelength range, data interval, scan speed, photometric type, slit width). Use blank solvent for baseline correction, then measure the sample spectrum.
- Powder samples: Preheat for 20 minutes. Set parameters. Use a barium sulfate white plate for baseline correction, then measure the sample spectrum.
- Bulk/film samples: Set parameters. Use a barium sulfate white plate for baseline correction. Fix the sample in place, align the test surface, and measure the spectrum.
Sample Requirements
- powder samples: at least 100 mg is required. If the sample amount is insufficient, barium sulfate will be mixed in and pressed into a pellet for testing (barium sulfate is used as a blank for background subtraction), so sample recovery is not recommended.
- film or bulk samples: the size should be around 1 × 1 cm. Please be sure to indicate the test surface.
- liquid samples: 10–15 mL is needed. The solvent should be non-toxic and odorless (for non-aqueous solvents, please provide a blank solvent for background subtraction), and the concentration must be specified.
- bulk samples with a film on a substrate: if you want to subtract the influence of the substrate, please prepare two blank substrates.
- The reflectance measured in UV testing is relative reflectance, i.e., relative to a standard sample: R’∞ = R∞(sample) / R∞(reference). The reference is usually a PTFE standard or a BaSO₄ white plate.
Application Case

application
Ultraviolet-visible spectroscopy (UV-Vis spectroscopy) utilizes the selective absorption, transmission, or reflection of light by substances to determine, analyze, and infer the composition, content, and structure of materials.
- Qualitative analysis: Used to determine conjugation relationships and the presence of certain functional groups. For example, if there is no absorption peak between 200 and 400 nm, it indicates that the unknown substance has no conjugation and is unlikely to be an aldehyde or ketone; it is most likely a saturated compound.
- Quantitative analysis: Used to determine the concentration or content of a substance.
- Identification of isomers: For example, ethyl acetoacetate exists in keto-enol tautomeric forms. The keto form does not have a conjugated double bond and shows a weak absorption at 204 nm, while the enol form has a conjugated double bond and shows a strong absorption at 245 nm. Therefore, the presence of these forms can be determined based on their UV absorption spectra.
- Purity check:
- For instance, if a compound does not have an absorption peak in the UV region, but an impurity has a strong absorption, it is easy to detect trace impurities in the compound.
Example Result

Results
Qualitative analysis
- Taking the isoindigo-based polymers P2-rn and P3-rn as examples, isoindigo-based D-A polymers typically exhibit two absorption bands, namely band I and band II. Band I can be further divided into the 0-0 and 0-1 peaks, among which the 0-0 peak reflects the degree of molecular aggregation—the higher the 0-0 peak, the stronger the aggregation. The only structural difference between these two polymers lies in the length of one of the alkyl side chains: the alkyl side chain in P3-rn is eight carbon atoms longer than that in P2-rn.
- As shown in the UV-Vis absorption spectra, the intensity ratio of the 0-0 peak to the 0-1 peak decreases from P2-rn to P3-rn, indicating that P3-rn exhibits weaker aggregation in solution. This observation is consistent with the solubility comparison, where P3-rn demonstrates significantly better solubility at the same concentration. In other words, the molecules of P3-rn are less prone to aggregation and are better dispersed.
Results
semi-quantitative analysis
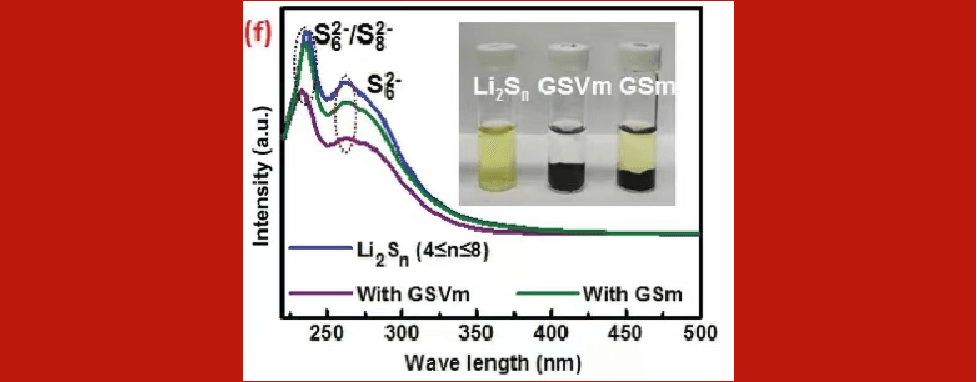
- As shown in the figure, the UV-Vis absorption spectra of the solutions after adsorption were measured. By comparing the intensity of the absorption peaks, it can be observed that, relative to the original lithium polysulfide solution, the absorption peak intensities of the lithium polysulfide solutions after adsorption with samples GSVm and GSm both decrease.
- Moreover, the absorption peak intensity decreases more significantly after adsorption with sample GSVm, indicating that GSVm has a stronger adsorption capacity for lithium polysulfides, resulting in a greater reduction in the concentration of lithium polysulfides in the solution.
Conclusion
UV-Vis absorption spectroscopy is an efficient, sensitive, and widely used analytical method suitable for both qualitative and quantitative analysis in various fields. It is easy to operate and cost-effective, but has limitations in analyzing complex samples and in structural elucidation. It is often used as a routine screening and preliminary analysis tool, and should be combined with other methods for comprehensive analysis when necessary.
What our customers are saying
Need precise analysis? Contact us – we'll help you choose the best solution for your needs.

Frequently Asked Questions
- Absorbance (A) is defined as the negative logarithm (base 10) of transmittance (T):A=-lgT
- When the transmittance is less than 10%, the absorbance can obviously be greater than 1.
- Absorbance is the base-10 logarithm of the ratio of the incident light intensity before the light passes through a solution or substance to the transmitted light intensity after the light passes through the solution or substance.
- It is often mistakenly thought to be the ratio of absorbed light intensity to incident light intensity, but actually, it is based on the transmitted light.
- These jumps correspond to the switching of light sources (differences in light source intensity) and detectors (differences in signal levels).
- For example, fluctuations around 300 nm are due to lamp switching (from visible to UV), and fluctuations around 800 nm are due to detector switching (from visible to NIR). The exact wavelength of these fluctuations may vary depending on the instrument, and the actual fluctuation also depends on the sample.
- Both absorbance and diffuse reflectance data can be used to calculate the band gap.
- Absorption rate is not a strictly defined concept, but it can be understood as 1−R%−T%, where R% is reflectance and T% is transmittance.
- However, in practice, this calculation is not very accurate because both R% and T% are relative values, and the areas tested for transmission and reflection may not be exactly the same, leading to errors or even negative values.
- Therefore, it is generally not recommended to calculate absorption rate this way, except for special homogeneous materials like optical glass or thin films.
- For liquid samples, if you need absorption rate data and want to use 1−R%−T%, make sure the sample is dilute and scattering is minimal or negligible, so R% can be ignored. In this case, you can simply measure transmittance T% and use 1−T%.