
info@universallab.org
WhatsApp: +41762172997

logo-header
​
logo
Material Testing
Mechanical Testing
Tensile TestFibre Tensile TestHardness TestImpact TestFatigue TestOthers
Thermal Testing
Thermomechanical AnalysisDSCTGATGA (TG-DSC, TG-DTA)
Surface, Coating and Corrosion
Adhesion TestScratch TestCorrosion Cycle Test
Physical Properties
Functional propertiesPorosityDensity
Elemental & Chemical Composition
Compositional analysisElemental analysis
Microscopic Characterization
Particle analysisMicroscopy
Product Testing
Food & Agriculture Testing
Consumer Goods Testing
Electronics & Electrical Testing
Medical & Pharmaceutical Testing
Automotive & Transportation Testing
Packaging & Materials Testing
Chemical & Hazardous Substances Testing
Semiconductor Testing
Battery Testing
Petrochemical Testing
Environmental Test
Water Testing
Drinking Water Analysis
Soil & Sediment Testing
Soil Chemistry (pH, Nutrients)
Air Testing
Particulate Matter (PM2.5, PM10)
Noise & Acoustic Testing
Industrial/Occupational Noise
Waste & Sludge Testing
Hazardous Waste Classification
Instrumental Test
Spectroscopy
Emission
XRFXPSICP-OESGD-OES
Absorption
FTIRUV/VIS/NIRAAS
Mass Spectrometry
SIMSICP-MS
Other
RamanNMR
Microscopy
Electron
SEMTEMEBSDEMPA
Other
AFMFIB
Mechanical
Volumetric
Tensile TestFibre Tensile TestImpact TestFatigue Test
Surface
HardnessNanoindentationScratch
Others
Thermal Analysis
TGADSC
Physical Analysis
BETLaser diffractionDensityContact AngleZeta potential
Chromatography
GCHPLCIC
Services
  • Applications
  • Techniques
  • Standards
  • Industries
Regulatory testing
  • PFAS
  • REACH
  • VOC
Environmental testing
  • Water
  • Gas
Data analysis
  • XRD
  • XPS
  • FTIR
  • Raman
  • NMR
  • CT
  • SIMS
  • TGA
Blog
  • Knowledge
  • News
  • Policy
  • About us
    Contact

    Sample Requirements

    Application Case

    Example Result

    What our customers are saying

    Need precise analysis? Contact us – we'll help you choose the best solution for your needs.

    info@universallab.org+41 762172997
    Lab technician holding a blue flask

    Frequently Asked Questions

    HomeCategoryCart
    logo-footer-shop1

    European material analytical and measuring service provider dedicated for academic and industrial research

    About Us
    CareersTerms & ConditionsPrivacy Policy
    Customer Services
    Help CenterBecome a partnerReturns & Refunds
    Contact Us

    Parkstrasse 1, 5234 Villigen, Switzerland

    Email: info@universallab.org

    Phone: +41 762172997

    VAT: CHE-265.266.739 MWST

    © 2026 By Universallab. All rights reserved.

    This site is protected by reCAPTCHA and the Google Privacy Policy and Terms of Service apply.
    product
    product-0

    Glow Discharge Optical Emission Spectroscopy (GD-OES)

    Variant (SKU)
    Depth profiling
    Time-intensity curve

    Price may vary based on selected options

    Delivery time: 1 ~ 2 weeks

    Introduction

    Introduction

    Introduction

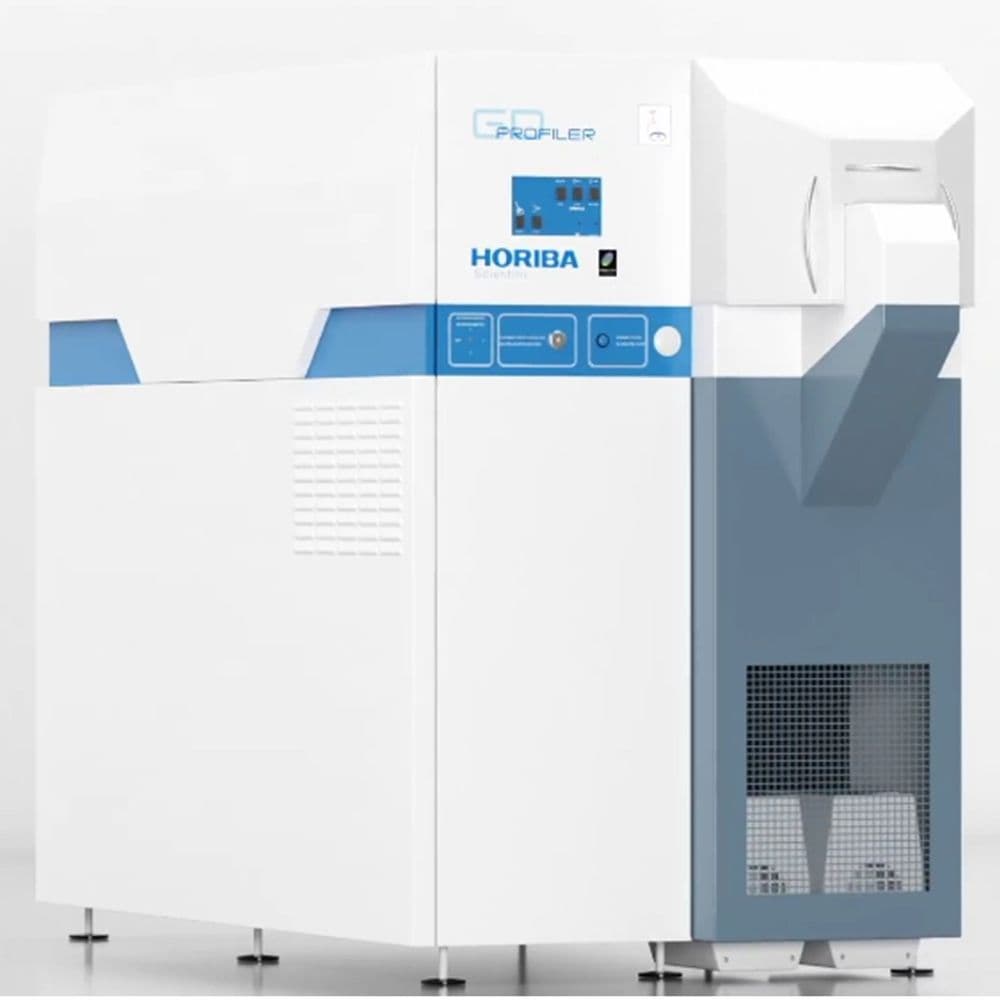
    Glow discharge optical emission spectroscopy (GDOES) is a quantitative, chemical analytical technique used to study the elemental composition of solids. It is particularly well suited for analysis on thin- and thick-film samples, or for depth-profiling of multilayer film stacks.

    Strengths

    • Accepts both conductive and insulating materials
    • Faster data collection and depth profiling than mass spectroscopy techniques
    • Reduced mass interferences improve compositional accuracy for low-mass elements
    • One tool for surface, depth profile, and bulk analysis
    • Can detect light elements such as H, C, N, O that methods like ICP-MS cannot detect
    Principle

    Principle

    Principle

    • Glow Discharge Plasma Generation: A glow discharge is created in a low-pressure gas (usually inert gases like argon) between two electrodes. When a voltage is applied, the gas becomes ionized, forming a plasma.
    • Sample Erosion: The sample to be analyzed is placed in the plasma. The energetic ions in the glow discharge bombard the surface of the sample, causing material to be sputtered away. This process erodes the surface layer of the sample.
    • Excitation of Atoms: As the sample material is sputtered into the plasma, the atoms are excited by the energy from the plasma. This excitation causes the atoms to emit light at characteristic wavelengths.
    • Emission Spectroscopy: The emitted light is collected and analyzed using a spectrometer. Each element emits light at specific wavelengths, allowing for the identification and quantification of the elements present in the sample.
    • Data Interpretation: The intensity of the emitted light is proportional to the concentration of the elements in the sample, enabling quantitative analysis.

    • Detection Principle: GDMS Detects ions with a mass spectrometer; GDOES Detects photons emitted by excited atoms using optical emission spectroscopy.
    • Sensitivity: GDMS>GDOES
    • Element Coverage: GDMS>GDOES
    • Analysis Time: GDMS>GDOES
    • Depth Profiling: GDMS<GDOES
    • Cost: GDMS>GDOES.

    • Lower sensitivity for trace elements as compared to GDMS
    • Requires more extensive calibration for accurate quantification with matrix effects

    • Analysis time: GDOES<SIMS
    • Particles detection: GDOES: ion mass spectrometry; SIMS: atomic (ion) spectroscopy
    • Sample amount : GDOES>SIMS
    • Cost: GDOES<SIMS

    Application

    Applicable industries

    Applicable industries

    Applicable materials type

    • Metals: copper, aluminum, titanium, and their alloys
    • Semiconductors: silicon, germanium, and compound semiconductors
    • Glass: certification and quality assurance of metals and alloys.
    • Ceramics: thin films, coatings, and functional layers.
    • Polymers: the composition and depth profiles of polymer materials, including coatings, composite materials, and functional layers.
    Industrial Application

    Industrial Application

    Industrial Application

    • Iron and steel industry: determine the elemental composition of iron and steel alloys or their coatings
    • Aerospace sector: assess the thickness and uniformity of coatings, depth profiling
    • Electronic industry: failure analysis, assess purity and detect trace elements that may affect semiconductor device performance
    • Plastics industry: coating and surface treatment evaluation, depth profiling
    • Surface technology: evaluating surface treatments
    • Environmental Monitoring: analyze contaminants, trace elements, and pollutants in various samples.
    Heat treatment: Carburizing

    Heat treatment: Carburizing

    Heat treatment: Carburizing

    To increase the wear protection, carbon is introduced into steel. The layer thicknesses of such carbon layers may be up to 1 mm. Since the maximum layer thickness detectable by GDOES amounts to approx. 200 µm, these layers cannot be measured in a single step. Instead, several measurements are performed on the same sample.After the first measurement the sample is grinded a little bit in such a way, that the first burning spot is still visible. The next measurement is performed on the grinded area as near as possible to the old spot. The recorded spectra are stringed together to a single profile. This procedure can be repeated until the desired depth is reached. The figure shows a depth profile combined of several measurements. Only the elements iron and carbon are displayed.

    Aluminum cladding

    Aluminum cladding

    Aluminum cladding

    Aluminum cladded materials are used in the automotive industry for cooling fins and radiators etc. They consist of two different aluminum alloys glued by heat and pressure. The control over the thickness of the cladding as well as the purity of the layers and the surface is of great importance. As can be seen in the figure on the left, the alloy on the surface contains silicon while the alloy beneath contains manganese, magnesium and copper. The turning point of a curve (black framed area in the diagram) defines the end of a layer. In this case, the layer thickness of the Si-containing alloy amounts to 34 µm. (as described in This Application Note).

    In contrast to microscopic methods GDOES does not require a laborious and time consuming sample preparation. Samples must meet only four criteria:

    CriteriaReason
    1.) Under standard conditions: flat sample surface required.1. ) The sample surface must seal the glow discharge source tightly. So a proper vacuum can be generated and no contaminations from the atmosphere can get into the sample chamber.
    2.) Minimum sample size: 20 mm for the 8-mm-anode, 15 mm for the 4-mm-anode and 6 mm for the 2.5-mm-anode.2. ) The sample surface must seal the glow discharge source tightly. So a proper vacuum can be generated and no contaminations from the atmosphere can get into the sample chamber.
    3.) Surface must be dry and free of oil and dirt.3.) Even small traces of oil and dirt are detected and can falsify the analytical results.
    4.) The distance between the anode and the reamer is 45 mm. Samples exceeding this size must be cut.4.) Otherwise samples do not fit into the sample compartment.

    Key difference between GDOES and GDMS

    FeatureGDOESGDMS
    PrincipleOptical emission of excited atoms/ionsMass spectrometry of ionized atoms/ions
    Detection MethodPhotons (light intensity at wavelengths)Ions (mass-to-charge ratio, m/z)
    Primary UseDepth profiling (surface to bulk)Ultra-trace bulk analysis (ppb-ppt)
    SpeedVery fast (µm/min depth resolution)Slow (minutes to hours per sample)
    Depth ResolutionExcellent (1–10 nm)Poor (bulk analysis, no depth resolution)
    Detection Limitsppm to % (major/minor elements)ppt to ppb (trace/ultra-trace)
    Isotope SensitivityNoYes (resolves isotopes)
    Sample ConductivityRequires conductive samples (or RF mode for non-conductors)Handles conductors and non-conductors better
    Quantitative AnalysisSemi-quantitative (standards needed)Highly quantitative (standardless possible)

    Glow Discharge Optical Emission Spectroscopy (GD-OES) is an analytical technique used for elemental analysis of solid conductive materials. It operates by generating a glow discharge plasma in a low-pressure gas environment (typically argon) within a vacuum chamber. The excited atoms in the sample emit light at characteristic wavelengths, which is then analyzed to determine the elemental composition and concentration of the sample.