info@universallab.org
WhatsApp: +41762172997

logo-header
​
logo
Material Testing
Mechanical Testing
Tensile TestFibre Tensile TestHardness TestImpact TestFatigue TestOthers
Thermal Testing
Thermomechanical AnalysisDSCTGATGA (TG-DSC, TG-DTA)
Surface, Coating and Corrosion
Adhesion TestScratch TestCorrosion Cycle Test
Physical Properties
Functional propertiesPorosityDensity
Elemental & Chemical Composition
Compositional analysisElemental analysis
Microscopic Characterization
Particle analysisMicroscopy
Product Testing
Food & Agriculture Testing
Consumer Goods Testing
Electronics & Electrical Testing
Medical & Pharmaceutical Testing
Automotive & Transportation Testing
Packaging & Materials Testing
Chemical & Hazardous Substances Testing
Semiconductor Testing
Battery Testing
Petrochemical Testing
Environmental Test
Water Testing
Drinking Water Analysis
Soil & Sediment Testing
Soil Chemistry (pH, Nutrients)
Air Testing
Particulate Matter (PM2.5, PM10)
Noise & Acoustic Testing
Industrial/Occupational Noise
Waste & Sludge Testing
Hazardous Waste Classification
Instrumental Test
Spectroscopy
Emission
XRFXPSICP-OESGD-OES
Absorption
FTIRUV/VIS/NIRAAS
Mass Spectrometry
SIMSICP-MS
Other
RamanNMR
Microscopy
Electron
SEMTEMEBSDEMPA
Other
AFMFIB
Mechanical
Volumetric
Tensile TestFibre Tensile TestImpact TestFatigue Test
Surface
HardnessNanoindentationScratch
Others
Thermal Analysis
TGADSC
Physical Analysis
BETLaser diffractionDensityContact AngleZeta potential
Chromatography
GCHPLCIC
Services
  • Applications
  • Techniques
  • Standards
  • Industries
Regulatory testing
  • PFAS
  • REACH
  • VOC
Environmental testing
  • Water
  • Gas
Data analysis
  • XRD
  • XPS
  • FTIR
  • Raman
  • NMR
  • CT
  • SIMS
  • TGA
Blog
  • Knowledge
  • News
  • Policy
  • About us
    Contact

    Sample Requirements

    Application Case

    Example Result

    What our customers are saying

    Need precise analysis? Contact us – we'll help you choose the best solution for your needs.

    info@universallab.org+41 762172997
    Lab technician holding a blue flask

    Frequently Asked Questions

    HomeCategoryCart
    logo-footer-shop1

    European material analytical and measuring service provider dedicated for academic and industrial research

    About Us
    CareersTerms & ConditionsPrivacy Policy
    Customer Services
    Help CenterBecome a partnerReturns & Refunds
    Contact Us

    Parkstrasse 1, 5234 Villigen, Switzerland

    Email: info@universallab.org

    Phone: +41 762172997

    VAT: CHE-265.266.739 MWST

    © 2026 By Universallab. All rights reserved.

    This site is protected by reCAPTCHA and the Google Privacy Policy and Terms of Service apply.
    product
    product-0
    product-1

    DLS (Dynamic Light Scattering)

    Variant (SKU)
    Particle size analysis
    Zeta potential

    Price may vary based on selected options

    Delivery time: 1 ~ 2 weeks

    1. Introduction

    DLS (Dynamic Light Scattering) is a non-invasive technique for measuring the size distribution of nanoparticles and colloidal particles in suspension. It is widely used to characterize particle size, aggregation state, and stability of colloidal systems.

    Hydrodynamic Diameter (Dh) — Measures the effective diameter of particles in a liquid, accounting for the solvation layer
    Polydispersity Index (PDI) — Indicates the width of the particle size distribution; low values reflect uniformity
    Aggregation Detection — Reveals the presence of particle clusters or flocculation
    Zeta Potential (optional, with DLS+Electrophoresis) — Provides insight into surface charge and colloidal stability
    Temperature-Dependent Size — Monitors particle swelling, shrinkage, or aggregation under varying conditions

    DLS is particularly important in nanomaterials research, pharmaceuticals, polymers, and colloidal chemistry, offering rapid, reliable particle characterization before advanced imaging or scattering methods are applied.


    2. Scope

    DLS analysis is versatile and suitable for aqueous and organic suspensions, nanoparticles, proteins, polymers, and emulsions. The technique is non-destructive and requires minimal sample preparation.

    Applicable Material Types:

    • Nanoparticles: metallic, oxide, quantum dots, core-shell particles
    • Polymers and micelles: block copolymers, micellar assemblies
    • Proteins and biomolecules: size, aggregation, stability studies
    • Liposomes and vesicles
    • Colloidal suspensions: ceramic, silica, carbon-based nanoparticles
    • Emulsions and dispersions: oil-in-water, water-in-oil systems

    Industries and Applications:

    • Pharmaceuticals: nanoparticle drug carriers, protein therapeutics, liposomes
    • Nanomaterials: size optimization, aggregation studies
    • Cosmetics and food: emulsion stability, particle size uniformity
    • Chemical and polymer research: micelles, polymer aggregates, colloidal dispersions
    • Environmental science: nanoparticle tracking, colloidal pollutants

    DLS is often combined with TEM, SEM, AFM, NTA to provide complementary size and morphology information. For example, DLS gives bulk hydrodynamic size, while TEM visualizes individual particle shapes.


    3. Principle

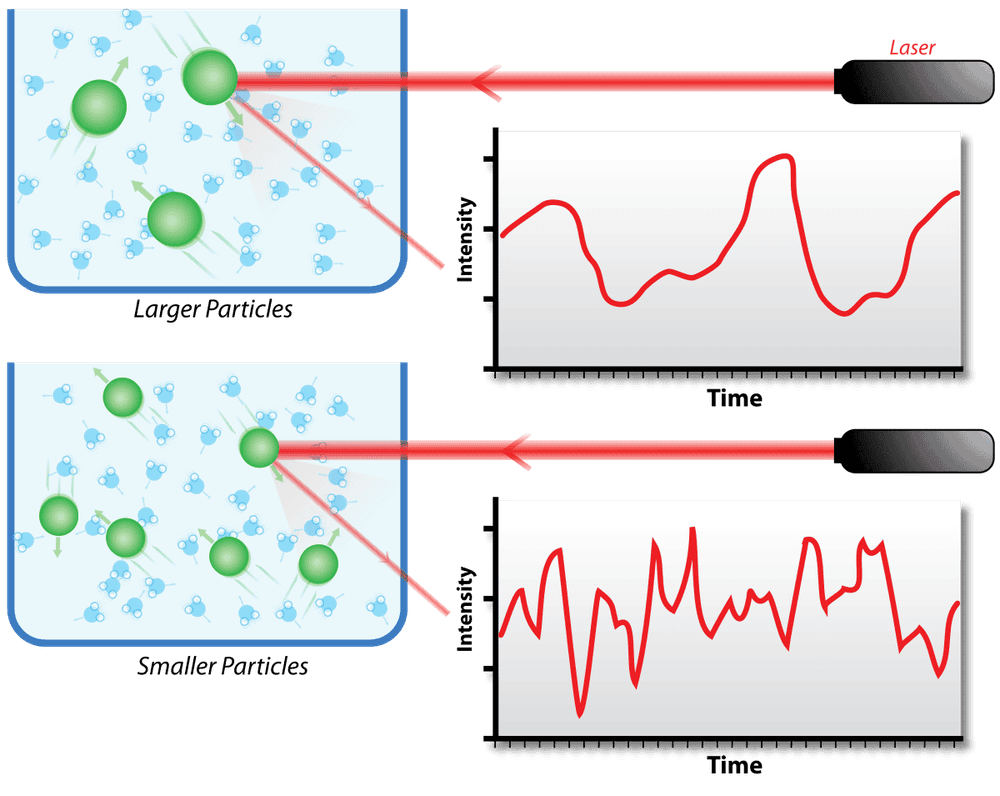
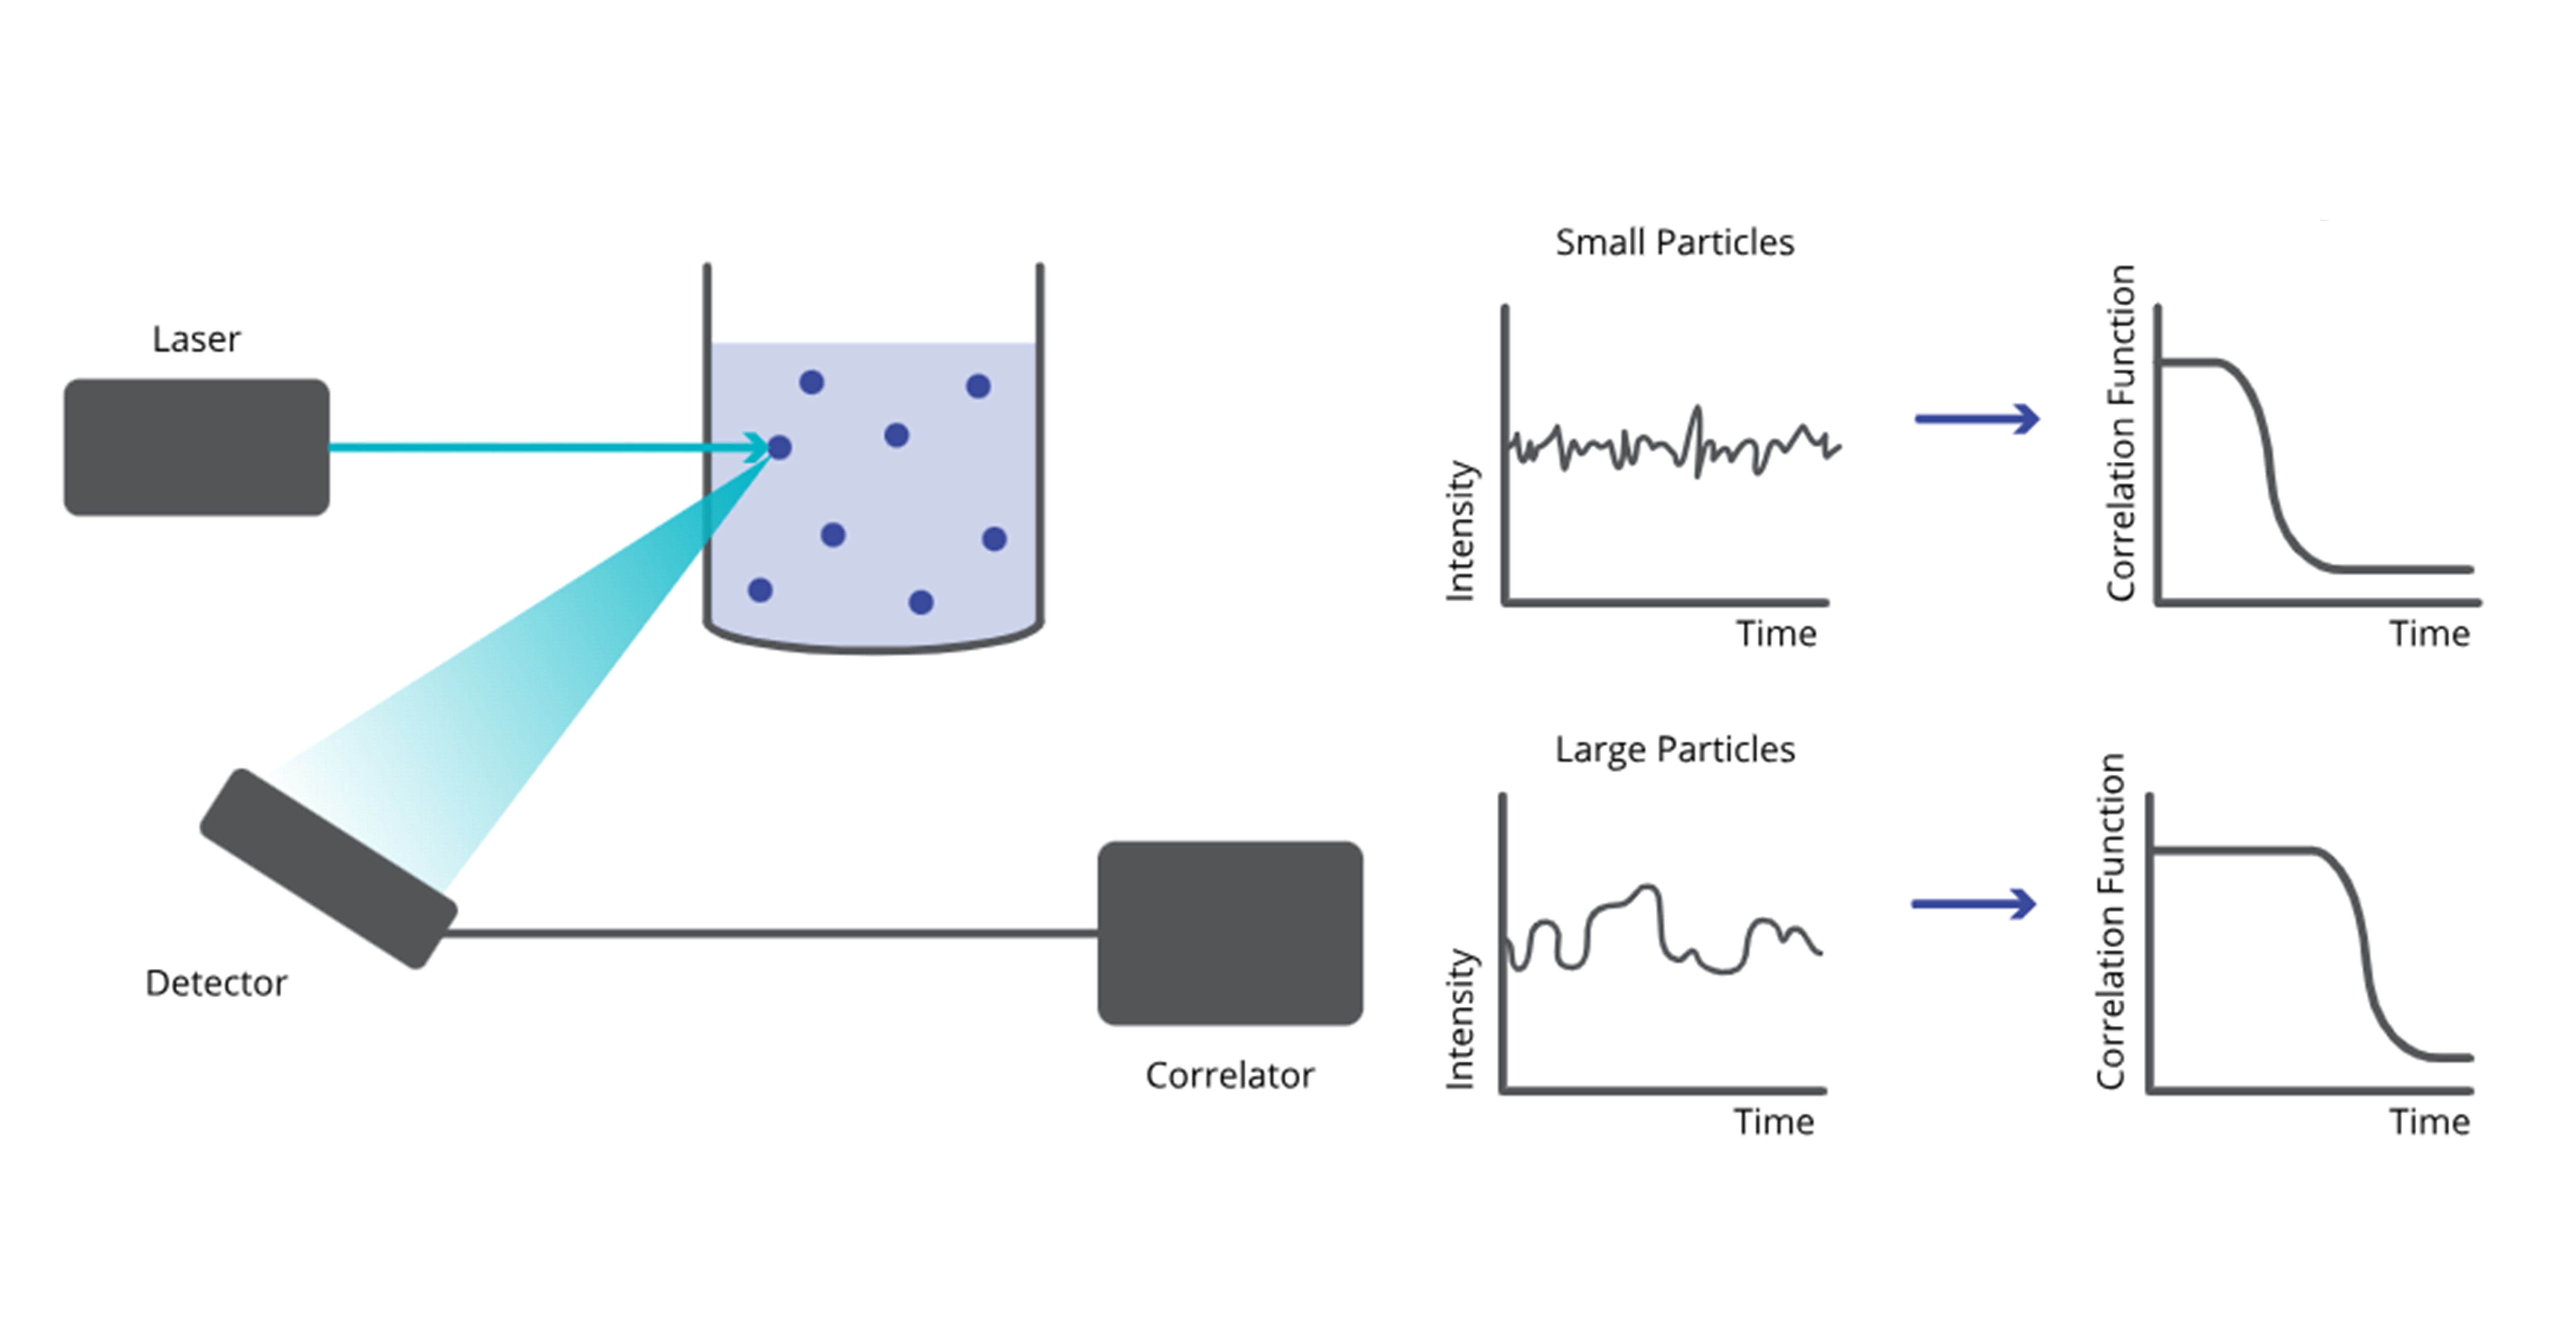
    DLS measures fluctuations in light scattering intensity caused by Brownian motion of particles in suspension. Smaller particles move faster, producing faster intensity fluctuations, while larger particles move slower. By analyzing the autocorrelation function of scattered light, the hydrodynamic diameter and polydispersity index are calculated.

    1. Why is the PDI high (>0.3)?
    A: High polydispersity indicates a wide size distribution, which may be caused by aggregation, impurities, or sample preparation issues.

    2. Why are the results different from TEM?
    A: DLS measures hydrodynamic size in liquid (including solvation layer), while TEM measures dry particle core size. Discrepancies are expected and complementary.

    3. Why do I see a second peak?
    A: Possible reasons include:

    • Aggregates or dust
    • Multimodal particle

    DLS analysis is versatile and suitable for aqueous and organic suspensions, nanoparticles, proteins, polymers, and emulsions. The technique is non-destructive and requires minimal sample preparation.

    Applicable Material Types:

    • Nanoparticles: metallic, oxide, quantum dots, core-shell particles
    • Polymers and micelles: block copolymers, micellar assemblies
    • Proteins and biomolecules: size, aggregation, stability studies
    • Liposomes and vesicles
    • Colloidal suspensions: ceramic, silica, carbon-based nanoparticles
    • Emulsions and dispersions: oil-in-water, water-in-oil systems

    Industries and Applications:

    • Pharmaceuticals: nanoparticle drug carriers, protein therapeutics, liposomes
    • Nanomaterials: size optimization, aggregation studies
    • Cosmetics and food: emulsion stability, particle size uniformity
    • Chemical and polymer research: micelles, polymer aggregates, colloidal dispersions
    • Environmental science: nanoparticle tracking, colloidal pollutants

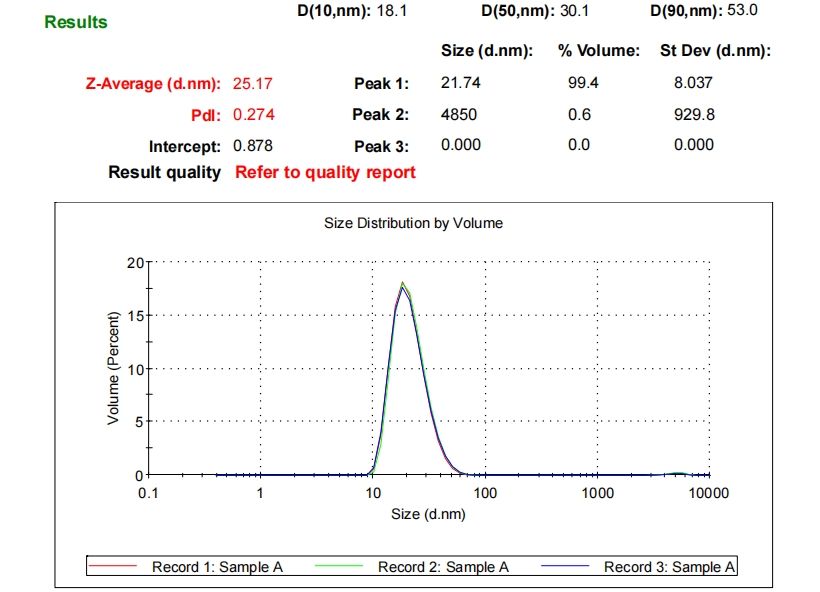
    Example of DLS results.

    ParameterValue
    Hydrodynamic Diameter (Z-average)85.3 nm
    Polydispersity Index (PDI)0.12
    Zeta Potential (if measured)-32.4 mV
    Particle Size Distribution Range60–110 nm
    1. Caption: Size distribution of polymer nanoparticles using DLS

    DLC-result.png

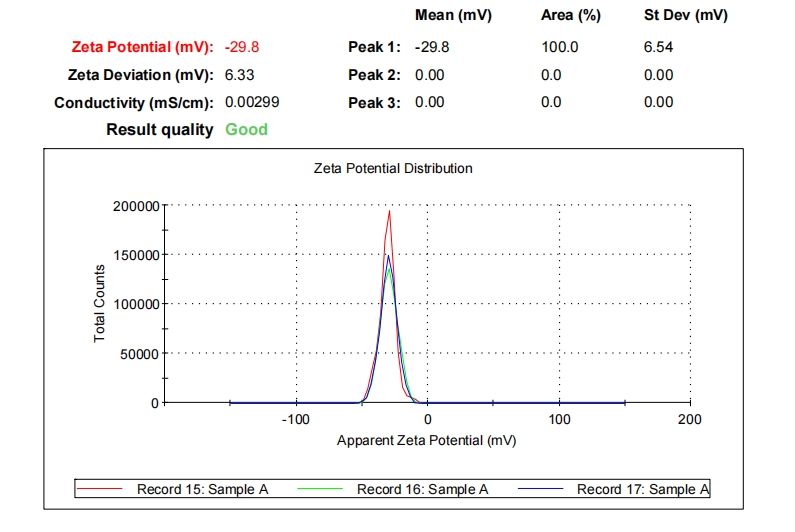
    1. Caption: Zeta potential of gold nanoparticles in citrate buffer

    ZETA-result.png

    To ensure accurate DLS results:

    • Sample volume: Typically 0.5–2 mL
    • Concentration: 0.1–1 mg/mL (adjust based on material type and scattering intensity)
    • State: Clear, homogeneous suspension; free from dust or large aggregates
    • Solvent: Compatible with instrument optics; low scattering background
    • Special materials: For light-sensitive or temperature-sensitive samples, provide handling instructions

    Contact our team for guidance on preparing challenging samples.

    1 Caption: Schematic illustration of DLS measurement principle
    DLS-principle.jpg


    4. Test Procedure

    The DLS measurement process includes the following steps:

    1. Sample Preparation: Dilute the suspension to avoid multiple scattering; filter or centrifuge if necessary.
    2. Loading: Place sample in a clean cuvette suitable for the instrument.
    3. Measurement: Laser light is scattered by particles; intensity fluctuations are recorded.
    4. Data Analysis: Autocorrelation function is processed to calculate hydrodynamic diameter and polydispersity.

    Measurements are conducted using fully automated, high-precision DLS instruments to ensure accuracy and repeatability.


    5. Sample Requirements

    To ensure accurate DLS results:

    • Sample volume: Typically 0.5–2 mL
    • Concentration: 0.1–1 mg/mL (adjust based on material type and scattering intensity)
    • State: Clear, homogeneous suspension; free from dust or large aggregates
    • Solvent: Compatible with instrument optics; low scattering background
    • Special materials: For light-sensitive or temperature-sensitive samples, provide handling instructions

    Contact our team for guidance on preparing challenging samples.


    6. Pros and Cons

    Comparison of Particle Size Analysis Methods (Method as Columns)

    AttributeDLSNTATEM/SEMAFMLaser Diffraction
    Working PrincipleMeasures Brownian motion via light scatteringTracks individual particle movementElectron imaging of dry particlesAtomic probe scanning of surfaceMie scattering of bulk sample
    Size Range1 nm – 1 µm10 nm – 2 µm1 nm – µm1 nm – µm0.1 µm – 3 mm
    StrengthsRapid, non-destructive, minimal sampleSize distribution of heterogeneous samplesHigh-resolution imaging3D surface topographyLarge particles and polydisperse systems
    LimitationsSensitive to aggregates; requires dilute sampleLimited by particle concentrationSample drying may cause artifactsSlow and low throughputLess sensitive to small nanoparticles
    Recommended MaterialsNanoparticles, colloids, polymersProteins, nanoparticlesNanoparticles, colloidsThin films, surfacesPowders, suspensions

    2 Caption: Overview of particle size analysis methods

    Advantages:

    • Fast and non-invasive
    • Requires small sample volume
    • Provides average hydrodynamic size and distribution
    • Applicable to a wide range of nanoparticles and colloids

    Limitations:

    • Sensitive to dust and aggregates
    • Cannot distinguish particle shape
    • Requires homogeneous, optically clear suspension

    7. Example Results

    Example of DLS results.

    ParameterValue
    Hydrodynamic Diameter (Z-average)85.3 nm
    Polydispersity Index (PDI)0.12
    Zeta Potential (if measured)-32.4 mV
    Particle Size Distribution Range60–110 nm
    1. Caption: Size distribution of polymer nanoparticles using DLS

    DLC-result.png

    1. Caption: Zeta potential of gold nanoparticles in citrate buffer

    ZETA-result.png


    8. FAQ

    1. Why is the PDI high (>0.3)?
    A: High polydispersity indicates a wide size distribution, which may be caused by aggregation, impurities, or sample preparation issues.

    2. Why are the results different from TEM?
    A: DLS measures hydrodynamic size in liquid (including solvation layer), while TEM measures dry particle core size. Discrepancies are expected and complementary.

    3. Why do I see a second peak?
    A: Possible reasons include:

    • Aggregates or dust
    • Multimodal particle

    DLS (Dynamic Light Scattering) is a non-invasive technique for measuring the size distribution of nanoparticles and colloidal particles in suspension. It is widely used to characterize particle size, aggregation state, and stability of colloidal systems.

    Hydrodynamic Diameter (Dh) — Measures the effective diameter of particles in a liquid, accounting for the solvation layer
    Polydispersity Index (PDI) — Indicates the width of the particle size distribution; low values reflect uniformity
    Aggregation Detection — Reveals the presence of particle clusters or flocculation
    Zeta Potential (optional, with DLS+Electrophoresis) — Provides insight into surface charge and colloidal stability
    Temperature-Dependent Size — Monitors particle swelling, shrinkage, or aggregation under varying conditions

    DLS is particularly important in nanomaterials research, pharmaceuticals, polymers, and colloidal chemistry, offering rapid, reliable particle characterization before advanced imaging or scattering methods are applied.