
info@universallab.org
WhatsApp: +41762172997
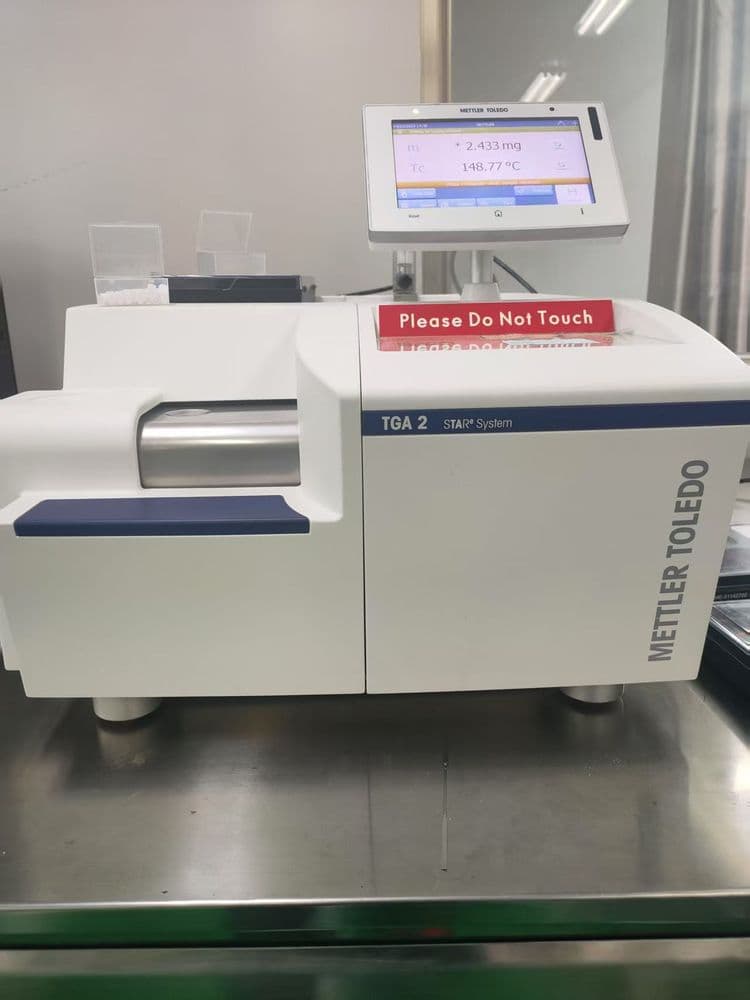
TGA(Thermogravimetric Analysis)
Variant (SKU)
RT-800℃
RT-1200℃
RT-1400℃
Price may vary based on selected options
Delivery time: 1 ~ 2 weeks
*Thermogravimetric Analysis (TGA) is a fundamental technique for studying the thermal stability and composition of materials. It measures the change in a sample’s mass as a function of temperature or time under a controlled atmosphere.
By continuously recording the weight loss or gain during heating, cooling, or isothermal conditions, TGA provides valuable insights into the material’s thermal decomposition behavior, moisture or solvent content, and oxidation or reduction processes.
The test yields key parameters such as: Thermal stability, Decomposition temperature, Mass loss rate, Residual content, and Reaction kinetics.
1. Introduction
Thermogravimetric Analysis (TGA) is a fundamental technique used to evaluate the thermal stability, composition, and decomposition behavior of materials. It measures the change in a sample’s mass as a function of temperature or time under a controlled atmosphere.
TGA provides key insights into material performance under thermal stress and helps identify transitions such as decomposition, oxidation, and evaporation. It is widely used for characterizing polymers, composites, inorganic materials, and functional solids.
Key Parameters:
Weight Loss (%) — Quantifies the mass change of a sample upon heating
Decomposition Temperature (°C) — Indicates the onset and completion of thermal degradation
Residual Content (%) — Determines inorganic or carbonaceous residue after heating
Thermal Stability — Evaluates the temperature range over which the material remains stable
Reaction Kinetics — Provides information on reaction mechanisms and activation energies
TGA is a cornerstone in material thermal analysis, offering quantitative information that complements other techniques such as DSC, DTA, or MS for a comprehensive understanding of thermal behavior and composition.
2. Scope
Thermogravimetric Analysis (TGA) is applicable to a broad range of materials in both research and industrial contexts. It is especially useful for evaluating the thermal stability, composition, and moisture or volatile content of solid samples.
Applicable Material Types:
- Polymers and plastics: PE, PP, PVC, PET, ABS, etc.
- Composites and coatings: fiber-reinforced composites, resin systems, paints
- Inorganic materials: oxides, carbonates, ceramics, minerals
- Carbon-based materials: activated carbon, graphite, CNTs, graphene
- Catalysts and supports: metal oxides, supported metals, zeolites
- Pharmaceutical and biological samples: excipients, active ingredients, lyophilized powders
- Battery and energy materials: electrode materials, electrolytes, binders
Industries and Applications:
- Polymer industry: characterization of thermal stability and filler content
- Catalyst research: assessment of thermal decomposition and regeneration behavior
- Energy materials: stability evaluation of electrodes and solid electrolytes
- Ceramics and metallurgy: oxidation and reduction studies, phase transformations
- Pharmaceuticals: moisture content and formulation stability testing
- Environmental studies: quantification of organic/inorganic content in residues and waste materials
TGA can be combined with complementary techniques such as DSC (Differential Scanning Calorimetry) for heat flow analysis or TGA–FTIR/MS coupling for evolved gas analysis, enabling simultaneous identification of decomposition products and reaction pathways.
3. Principle
TGA measures the change in mass of a sample as it is heated, cooled, or held isothermally under a controlled atmosphere (such as air, nitrogen, or argon). The relationship between mass and temperature/time provides direct information about the sample’s thermal events.
Typical thermal processes include:
- Desorption of moisture or solvents
- Decomposition of organic or polymeric components
- Oxidation or reduction reactions
- Formation of stable residues (e.g., metal oxides)
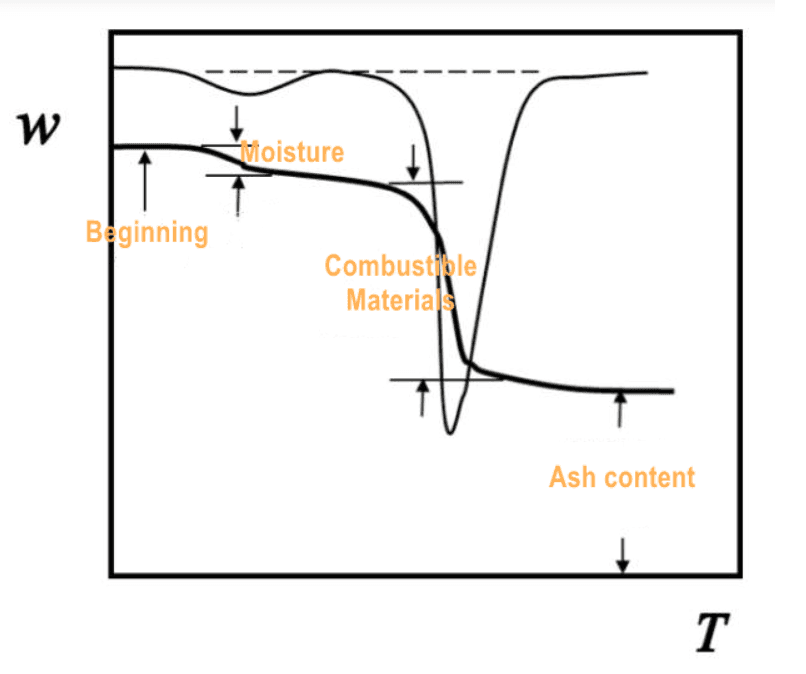
The mass loss curve (thermogram) and its derivative (DTG curve) are used to identify characteristic temperatures such as onset, peak, and end of decomposition events.
1 Caption: Typical TGA and DTG curves showing mass loss behavior during thermal decomposition
4. Test Procedure
The TGA process includes the following main steps:
- Sample Preparation: A small amount (typically 5–20 mg) of sample is accurately weighed into a crucible.
- Atmosphere Selection: The appropriate purge gas (e.g., air, N₂, Ar) is selected depending on the desired reaction environment.
- Temperature Program: The sample is heated at a controlled rate (commonly 5–20 °C/min) up to a target temperature.
- Data Recording: The instrument continuously measures the change in mass with temperature or time.
- Data Analysis: The resulting TGA and DTG curves are analyzed to determine thermal events, weight loss stages, and residual mass.
All measurements are conducted on automated thermogravimetric analyzers to ensure precision, reproducibility, and controlled environmental conditions.
5. Sample Requirements
Please follow the guidelines below for sample preparation and submission:
- Sample amount: 5–20 mg, depending on material density
- State: Solid or powder form preferred
- Condition: Dry and free from surface moisture or contamination
- Packaging: Use sealed, moisture-proof containers
- Special materials: For air-sensitive or volatile samples, please indicate specific handling requirements in advance
Our technical team can provide customized conditions (e.g., controlled atmosphere, heating rates) upon request.
6. Pros and Cons
Comparison of Thermal Analysis Methods (Method as Columns)
| Attribute | TGA (Thermogravimetric Analysis) | DSC (Differential Scanning Calorimetry) | DTA (Differential Thermal Analysis) | TMA (Thermomechanical Analysis) | DMA (Dynamic Mechanical Analysis) |
|---|---|---|---|---|---|
| Working Principle | Measures mass change with temperature | Measures heat flow difference between sample & reference | Measures temperature difference under heating | Measures dimensional change vs. temperature | Measures viscoelastic properties vs. temperature |
| Key Parameters | Weight loss, decomposition temp, residue | Melting point, Tg, crystallization temp | Phase transitions, reaction temperatures | Expansion coefficient, softening temp | Storage/loss modulus, Tg |
| Atmosphere | Inert or oxidative | Inert or oxidative | Inert or oxidative | Inert or air | Air or inert |
| Strengths | Quantitative mass change, compositional analysis | High sensitivity to thermal transitions | Simple and versatile | Measures expansion directly | Measures mechanical performance dynamically |
| Limitations | No direct heat flow data; limited to mass change | Cannot determine mass loss | Lower resolution than DSC | Not suitable for powders | Requires well-prepared sample geometry |
| Recommended Materials | Polymers, composites, ceramics, catalysts | Polymers, metals, phase-change materials | Minerals, ceramics | Films, fibers, solids | Elastomers, composites, polymers |
2 Caption: Comparison of Key Thermal Analysis Techniques and Their Applications

Advantages:
- Quantitative determination of thermal stability and composition
- Small sample amount required
- Applicable to both organic and inorganic materials
- Simple sample preparation and non-destructive to residues
Limitations:
- Does not directly measure heat flow or phase transitions
- Results depend on heating rate and atmosphere selection
7. Example results
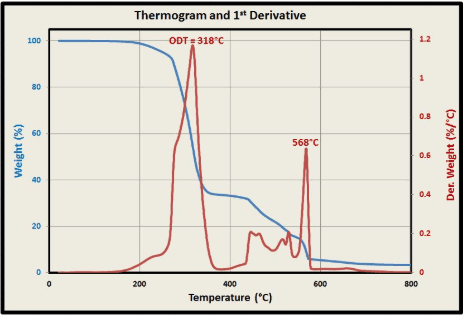
Example of TGA results.
| Parameter | Value |
|---|---|
| Initial sample mass (mg) | 10.000 |
| Onset decomposition temperature (°C) | 287.5 |
| Maximum decomposition rate (°C) | 322.1 |
| Total mass loss (%) | 76.8 |
| Residual mass (%) | 23.2 |
2 Caption: Typical TGA and DTG Curves
8. FAQ
1. Why does the TGA curve show multiple weight loss steps?
A: Each step corresponds to a different thermal event, such as moisture evaporation, decomposition of organics, or oxidation of residue. Multiple steps indicate complex material composition or multi-stage reactions.
2. Why does the sample show weight gain instead of loss?
A: This may occur when the measurement is performed under an oxidative atmosphere (e.g., air) and the sample reacts with oxygen, forming oxides or absorbing gases.
3. Why do TGA results vary under different atmospheres?
A: The reaction environment strongly affects decomposition pathways. For example, polymers may decompose in nitrogen but oxidize in air, leading to different mass loss behaviors and residual contents.
4. How does the heating rate influence TGA results?
A: Faster heating rates shift decomposition temperatures to higher values, while slower rates improve resolution of overlapping thermal events. A standard rate (e.g., 10 °C/min) is typically used for comparison.
5. Why is the residual mass higher than expected?
A: Possible causes include incomplete combustion, high ash content, or the formation of stable oxides that do not decompose under the test conditions.
6. Can TGA be used to determine filler content in composites?
A: Yes. By analyzing the weight loss stages, the content of polymer, filler, and additives can be quantified, especially when heating in air to burn off organic components.
7. What is the difference between TGA and DSC results?
A: TGA measures mass change, while DSC measures heat flow. Combining both methods provides a more comprehensive understanding of thermal behavior — for example, identifying whether an observed mass loss corresponds to an endothermic or exothermic event.
9. Conclusion
Thermogravimetric Analysis (TGA) is an essential technique for assessing the thermal stability, composition, and degradation behavior of materials. It is indispensable in quality control, research, and material design, helping engineers and scientists understand how materials perform under thermal conditions.
Contact us today to discuss your analysis needs or to submit your samples for testing.
Sample Requirements
Please follow the guidelines below for sample preparation and submission:
- Sample amount: 5–20 mg, depending on material density
- State: Solid or powder form preferred
- Condition: Dry and free from surface moisture or contamination
- Packaging: Use sealed, moisture-proof containers
- Special materials: For air-sensitive or volatile samples, please indicate specific handling requirements in advance
Our technical team can provide customized conditions (e.g., controlled atmosphere, heating rates) upon request.
Application Case
Thermogravimetric Analysis (TGA) is applicable to a broad range of materials in both research and industrial contexts. It is especially useful for evaluating the thermal stability, composition, and moisture or volatile content of solid samples.
Applicable Material Types:
- Polymers and plastics: PE, PP, PVC, PET, ABS, etc.
- Composites and coatings: fiber-reinforced composites, resin systems, paints
- Inorganic materials: oxides, carbonates, ceramics, minerals
- Carbon-based materials: activated carbon, graphite, CNTs, graphene
- Catalysts and supports: metal oxides, supported metals, zeolites
- Pharmaceutical and biological samples: excipients, active ingredients, lyophilized powders
- Battery and energy materials: electrode materials, electrolytes, binders
Industries and Applications:
- Polymer industry: characterization of thermal stability and filler content
- Catalyst research: assessment of thermal decomposition and regeneration behavior
- Energy materials: stability evaluation of electrodes and solid electrolytes
- Ceramics and metallurgy: oxidation and reduction studies, phase transformations
- Pharmaceuticals: moisture content and formulation stability testing
- Environmental studies: quantification of organic/inorganic content in residues and waste materials
TGA can be combined with complementary techniques such as DSC (Differential Scanning Calorimetry) for heat flow analysis or TGA–FTIR/MS coupling for evolved gas analysis, enabling simultaneous identification of decomposition products and reaction pathways.
Example Result
Example of TGA results.
| Parameter | Value |
|---|---|
| Initial sample mass (mg) | 10.000 |
| Onset decomposition temperature (°C) | 287.5 |
| Maximum decomposition rate (°C) | 322.1 |
| Total mass loss (%) | 76.8 |
| Residual mass (%) | 23.2 |
2 Caption: Typical TGA and DTG Curves
What our customers are saying
Need precise analysis? Contact us – we'll help you choose the best solution for your needs.

Frequently Asked Questions
1. Why does the TGA curve show multiple weight loss steps?
A: Each step corresponds to a different thermal event, such as moisture evaporation, decomposition of organics, or oxidation of residue. Multiple steps indicate complex material composition or multi-stage reactions.
2. Why does the sample show weight gain instead of loss?
A: This may occur when the measurement is performed under an oxidative atmosphere (e.g., air) and the sample reacts with oxygen, forming oxides or absorbing gases.
3. Why do TGA results vary under different atmospheres?
A: The reaction environment strongly affects decomposition pathways. For example, polymers may decompose in nitrogen but oxidize in air, leading to different mass loss behaviors and residual contents.
4. How does the heating rate influence TGA results?
A: Faster heating rates shift decomposition temperatures to higher values, while slower rates improve resolution of overlapping thermal events. A standard rate (e.g., 10 °C/min) is typically used for comparison.
5. Why is the residual mass higher than expected?
A: Possible causes include incomplete combustion, high ash content, or the formation of stable oxides that do not decompose under the test conditions.
6. Can TGA be used to determine filler content in composites?
A: Yes. By analyzing the weight loss stages, the content of polymer, filler, and additives can be quantified, especially when heating in air to burn off organic components.
7. What is the difference between TGA and DSC results?
A: TGA measures mass change, while DSC measures heat flow. Combining both methods provides a more comprehensive understanding of thermal behavior — for example, identifying whether an observed mass loss corresponds to an endothermic or exothermic event.